A dashboard that writes itself,
in conversation.
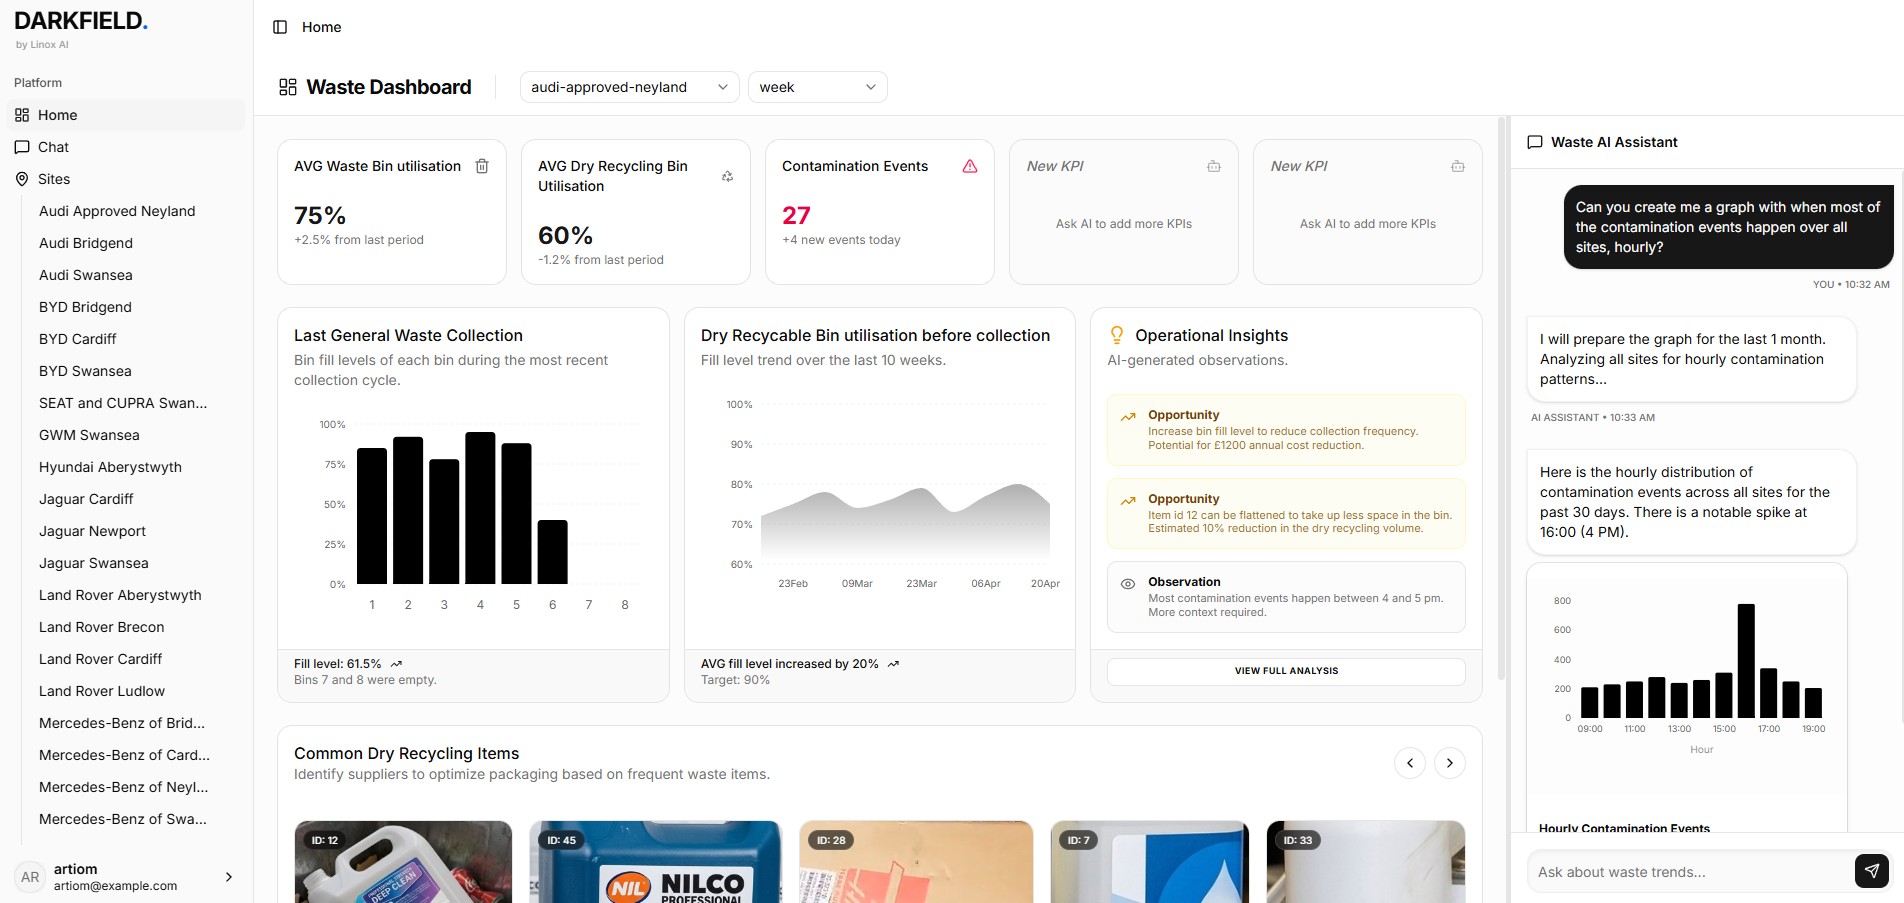
You don't drag widgets. You ask a question — and the answer becomes a tile you can pin, share, and schedule. Dashboards is where operational data becomes an ongoing conversation.
Ask a question.
Pin the answer.
Ask in the chat on the left. The dashboard on the right updates the moment a new event lands — no refresh, no cadence to set. Pin any tile with one click.
// answers become tiles. tiles become dashboards. every tile is live — new events land instantly, no refresh, no polling.
Built for the person
asking the question.
Three example boards from current partner deployments. Each tile is a pinned chat answer, live-querying on a schedule.
Data goes both ways.
Your systems don't change.
Dashboards reads your systems.
The AI joins a detection event with your ERP, WMS, MES, or SAP data. A pallet-ID detection becomes a purchase order. A number plate becomes a fleet record.
Every event is already in your pipeline.
Every Darkfield event is simultaneously a webhook payload, a Kafka topic, a Snowflake row, and an S3 object. Your downstream BI doesn't change. Dashboards is an interface on top of the same data your existing tools already consume.
Resolve IDs to names.
Upload a lookup table — forklift IDs to operator names, number plates to fleet records, pallet IDs to WMS references. The AI uses it at enrichment time to produce human-readable event rows in Dashboards.
Dashboards remembers
what you asked yesterday.
Standing questions become morning digests. Ask once, and Dashboards re-asks it every day, assembles the tiles, and sends a summary to your inbox before your shift starts.
// four standing questions · answered every morning · before the shift starts.
Ask your data
a direct question.
We're onboarding a small number of partners in private beta.